So what is Price Action?
It is a form of technical analysis and it uses candles on a chart which represents data. This data shows what the market has been doing for the specified time range. For example if it is a daily candle then it shows what the market did for that day. All economic data and global news that effect price in any way will be reflected on the price chart so it eliminates almost any use of following the news.
The main thing that separates price action trading from all other trading strategies is that it uses “clean” or “naked” charts. There are no indicators or anything confusing on your chart, the only thing that is there is raw price displayed as candles. This makes trading simpler and easier to read.
Many new traders, when starting out have a candle chart packed full of indicators and studies, thinking that they have come up with some holy grail system that will consistently give winning trades. Over time, what was working a few weeks ago, now seems to be a little less reliable and then, a new indicator comes out of the box and this is the one……. it goes on.
Eventually you look at your charts and you can’t see the wood for the trees, your charts are now so heavy with every indicator available, each one contradicting another that you no longer know if you are coming or going. At this point many give up convinced that this is too complicated, others discover Price Action Trading.
Take a look at the charts below:
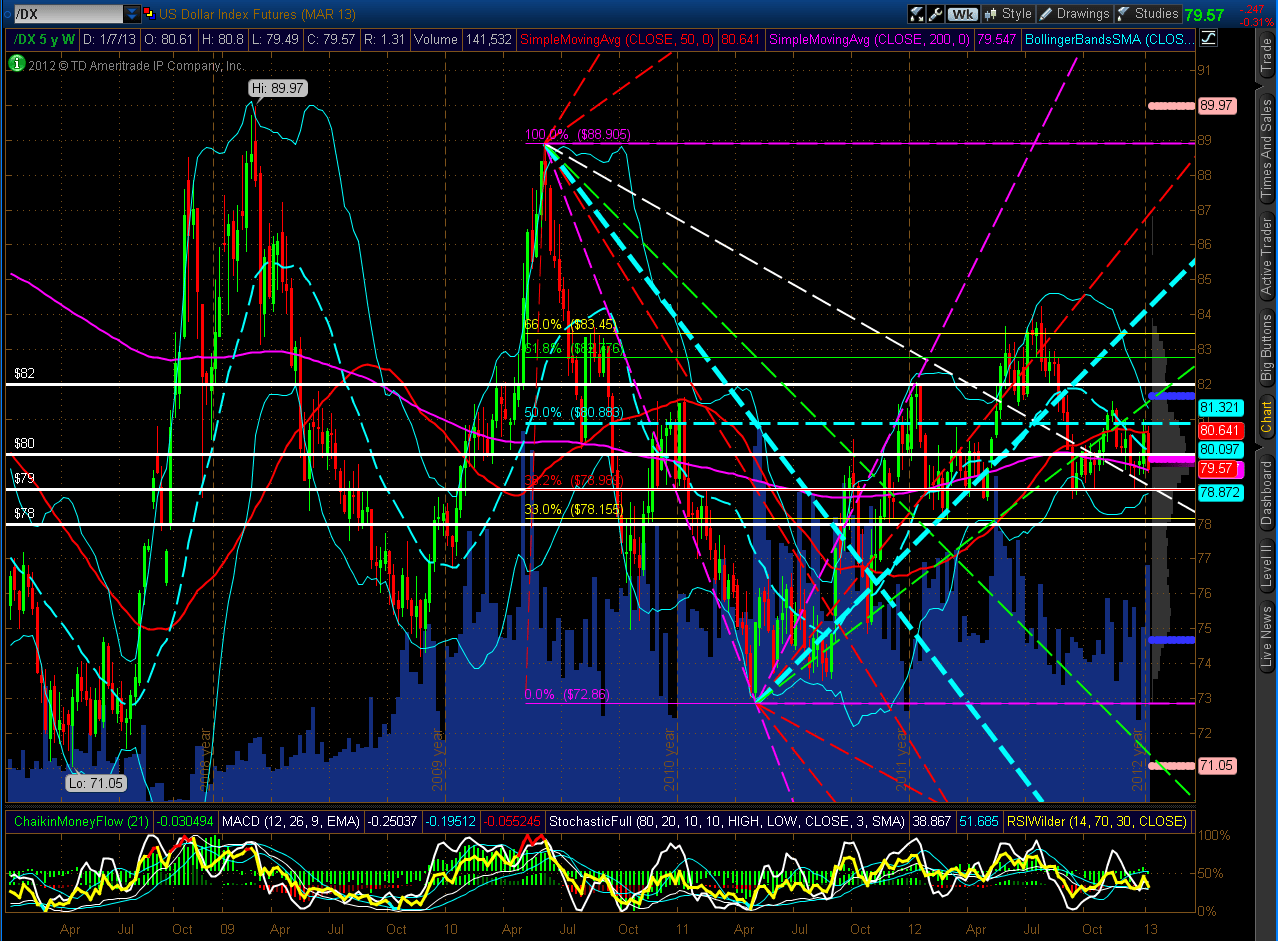
There is so much going on here, it is hard to see what is happening. Just a glance at the chart send your eyes spinning, how could anyone trade from this?
Technical analysis does not need to be this complicated.
Below is a chart stripped of all indicators showing pure price action:

The horizontal blue line is support and resistance level marked on the chart. It is from levels like this that we should watch for pin bars forming or other price action signals.
Trading can be simplified with a clean chart, we can actually get a much clearer picture of what is going on with a particular currency pair or stock.